
Adding a Time Graph
A time graph displays line charts of one or more signals over time. When scanning an ECU, the charts are drawn in real time. During playback of a log file, they display a time window surrounding the current time index of the playback.
To add a time graph,
| 1. | In the menu bar, select Layout > Add Control > Add Measurement > Add Time Graph. The below window will appear, create your desired group (s) with which ever measurements you desire, utilize the below (Adding a Group & Adding a Signal (Measurement) to a Group) instructions to do so. |
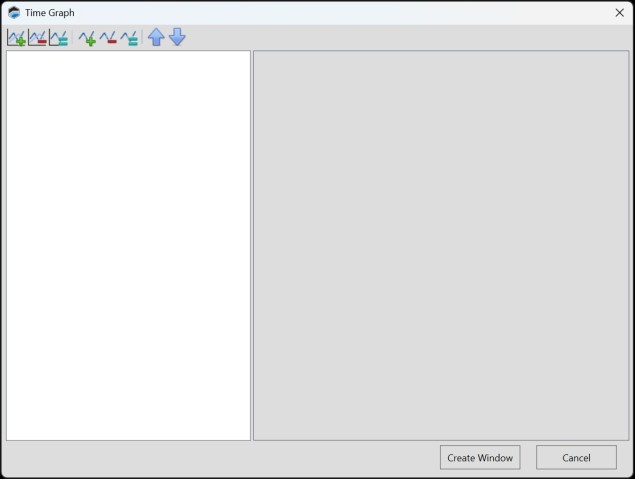
| 2. | When configuration is complete, Click Create Window. |
Adding a Group
| 1. | Click |
| 2. | Add the desired signals to the group using the instructions below. |
Adding a Signal (Measurement) to a Group
| 1. | Click on the desired group you intend to add a measurement too. |
| 2. | Click |
| 3. | Search for the measurement you wish to add. |
| 4. | Double-click on the measurement whose output you want to display. |
| 5. | Complete signal setup by configuring the signal's parameters. |
Editing an Existing Signal (Series)
To configure a signal that is already included in this layout:
| 1. | Select the name of the signal in the column on the left. |
| 2. | Modify the signal parameters displayed on the right. |
Toolbar
|
|
Add a new (empty) chart group. To complete group setup, add the signals (series) that would be included in the group. |
|
|
Delete the chart group selected in the left column. |
|
|
Duplicate the group selected in the left column. |
|
|
Add a new signal (series) to the group selected in the column on the left. To complete signal setup, you must configure the signal's parameters. |
|
|
Delete the signal (measurement) selected in the left column. |
|
|
Duplicate the signal (measurement) selected in the column on the left. |
|
|
Move the signal selected in the left column upwards in the list. |
|
|
Move the signal selected in the left column downwards in the list. |
