
Using Time Graph Subwindows
This type of subwindow displays line charts of a set of selected parameters over time. When scanning a vehicle, these charts are drawn in real time. During playback of a log file, they display a time window surrounding the current time index of the playback.
|
Item |
Description |
|||||||||
|---|---|---|---|---|---|---|---|---|---|---|
|
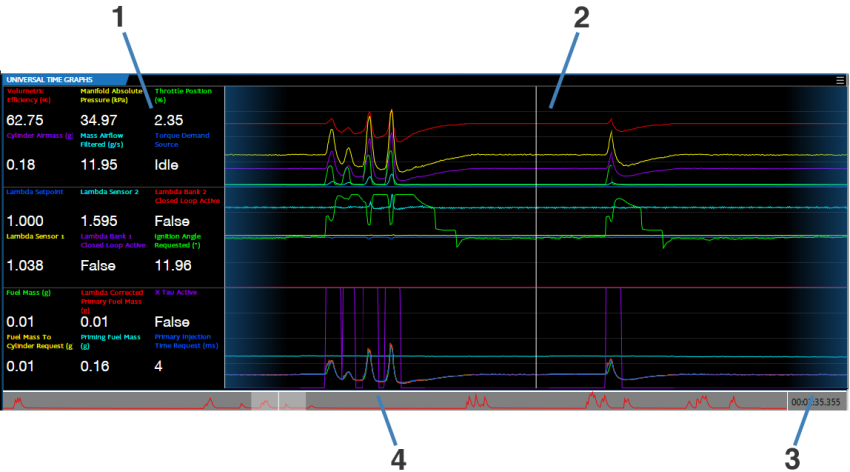
1. |
Current Parameter Values. When recording live data, this area displays the current values of the parameters being tracked. During playback, it shows the values at the current time index. |
|||||||||
|
2. |
Parameter Line Charts. Tracks the value of the displayed parameters over time.
|
|||||||||
|
3. |
Time Index. During playback of a log file, this vertical bar indicates the current time index. All data displayed in the layout reflects the values at this moment, including:
When playback is paused, you can examine the values at a specific moment by clicking anywhere on the line charts. The bar will move to the position clicked. |
|||||||||
|
4. |
Timeline. When playing back a log file, the timeline represents the total length of time captured in the log. Drag the slider to move to a different time index. Appears only when a log file is open. |
See Adding a Time Graph for information on creating and configuring time graph subwindows.
